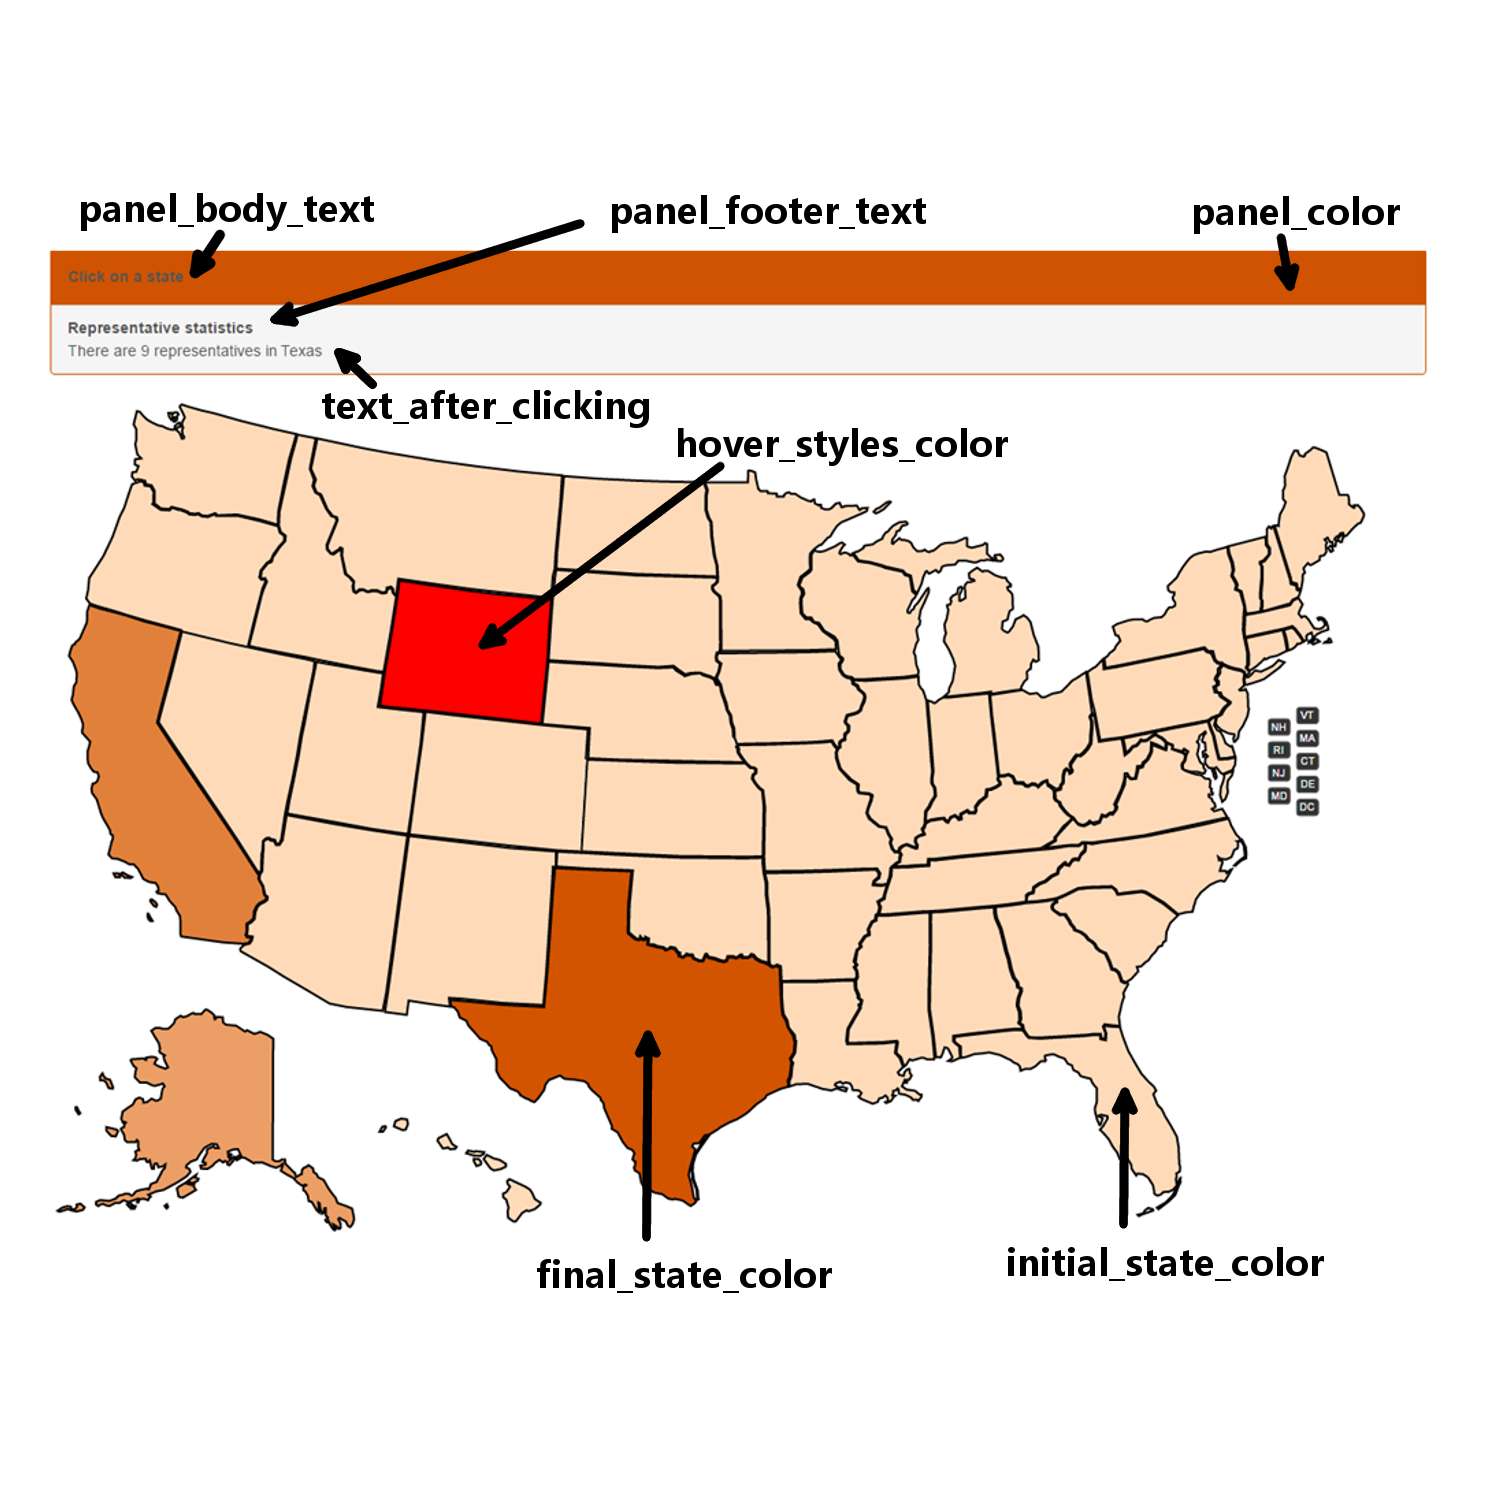
Description
A plugin that allows users to easily show a “heat distribution” of data across a usmap. For example, if you wanted to show which states your company’s representatives are in, each state would correspond to the number of representatives. This would be converted to graphically show on a US map. All you need is an initial color of the state (representing 0) and the color that represents the highest value within all the states. This plugin will then calculate the colors of all the other states and graphically display it.
This is a very simple plugin that provides some graphical distribution across the U.S. map. I hope you find it useful to your site!


