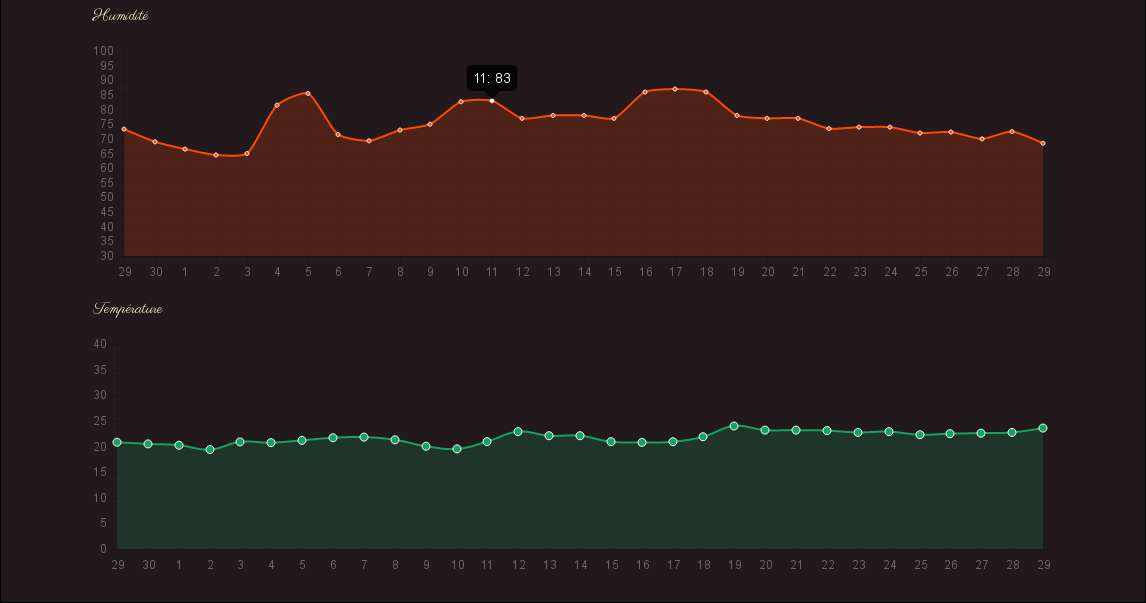
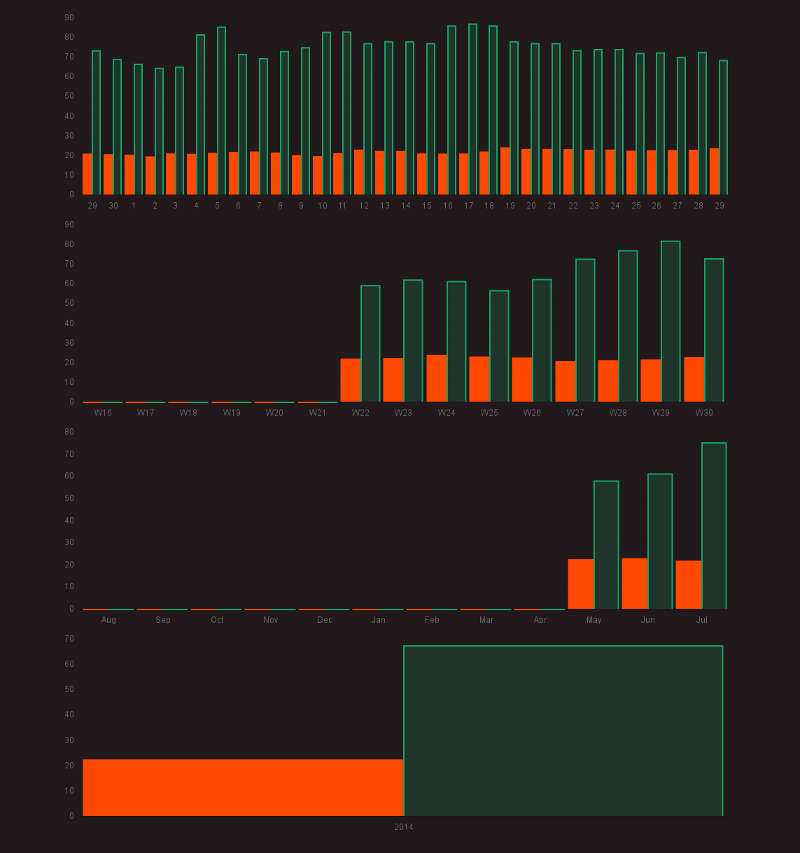
Description
This plugin collect data attached to post/article via custom field and make
chart of it.
This plugin use Chart.js for chart drawing ChartJs
Data are collected by looking for specific custom field attached to your
post/page. You can change aggregation method, intervall…
See usage
Usage
Edit your post/page in text mode and put some Javascript and a WordPress tag
Minimum
<script>
var mydata = { datasets: [{}]};
</script>
[custom_field_chart fields="humidity" js_data="mydata"]
For each field you need to put empty {} into datasets.
For two fields:
<script>
var mydata = {datasets: [{},{}]}
</script>
[custom_field_chart fields="humidity,temperature" js_data="mydata"]
But it’s pretty useless to put more than one field without different colors 🙂
More
<script>
var mydata = {
    datasets: [
        {
            label: "Humidity",
            fillColor: "rgba(255,73,0,1)",
            strokeColor: "rgba(255,73,0,1)",
            pointColor: "rgba(255,73,0,1)",
            pointStrokeColor: "#fff",
            pointHighlightFill: "#fff",
            pointHighlightStroke: "rgba(220,220,220,1)",
        },
        {
            label: "Temperature",
            fillColor: "rgba(255,73,0,1)",
            strokeColor: "rgba(255,73,0,1)",
            pointColor: "rgba(255,73,0,1)",
            pointStrokeColor: "#fff",
            pointHighlightFill: "#fff",
            pointHighlightStroke: "rgba(220,220,220,1)",
        },
    ]
};

var myopts = {
    pointDotRadius: 1,
    bezierCurveTension: 0.2,
    barStrokeWidth : 2,
    barValueSpacing : 2,
    barDatasetSpacing : 0,
};

// Optional...
jQuery(window).load(function() {
    Chart.defaults.global.responsive = true;
    Chart.defaults.global.animationEasing = "easeOutBounce";
    Chart.defaults.global.onAnimationComplete = function(){
        alert('Hello');
    }
});
// End optional
</script>

[custom_field_chart width="1000" height="300"
  kind="line" method="track" interval="day" interval_count="31"
  fields="humidity,temperature" js_data="mydata" js_options="myopts"]
Notes
- js_data and js_options must reflect name given to your javascript variable.
- Look at http://chartjs.org/ for documentation
- You don’t need to supply labels and data (like in chartjs.org example) 🙂
Tag attributes
= Required =
1. fields: Custom field separate by comma
1. js_data: Name of javascript variable holding chart datasets
Optional
- width: Chart width (default: 400)
- height: Chart Height (default: 200)
- method: Aggregate method track, delta or cumulative (defaul: track)
- interval: year, month, day (default: day)
- interval_count: How many year, mont or day (default: 31)
- js_options: Name of javascript variable holding chart options
- kind: Chart type line or bar (default: line)
- to_date: Current date by default, post date if ‘post’ specified else value supplied
- dump: Dumping attributes for debug (default: False)
- round: Rounding data with specified precision
Note
Beta software… Interface may change.


