Description
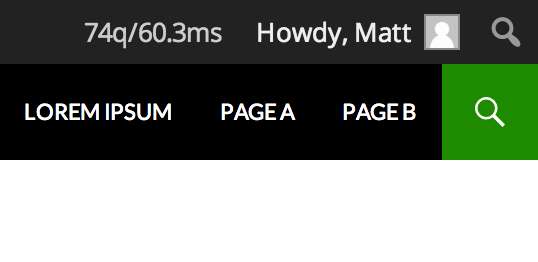
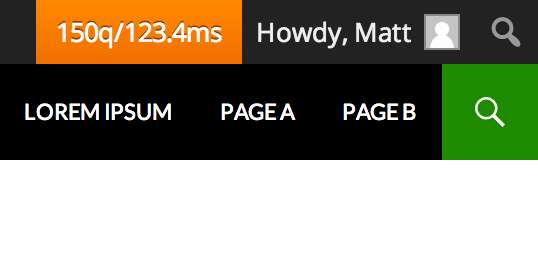
Replaces the default text in the Debug Bar button (which is “Debug Bar” by default in English) with the page’s query count and total sql time. The button will be red if there were more than 200 queries or they took more than 1 second to run, and orange if the page required more than 100 queries or took more than 0.5 seconds to run.
Requires the Debug Bar plugin and for the constant SAVEQUERIES to be true.
Inspired by the Admin Bar on WordPress.com VIP, which offers similar functionality.


